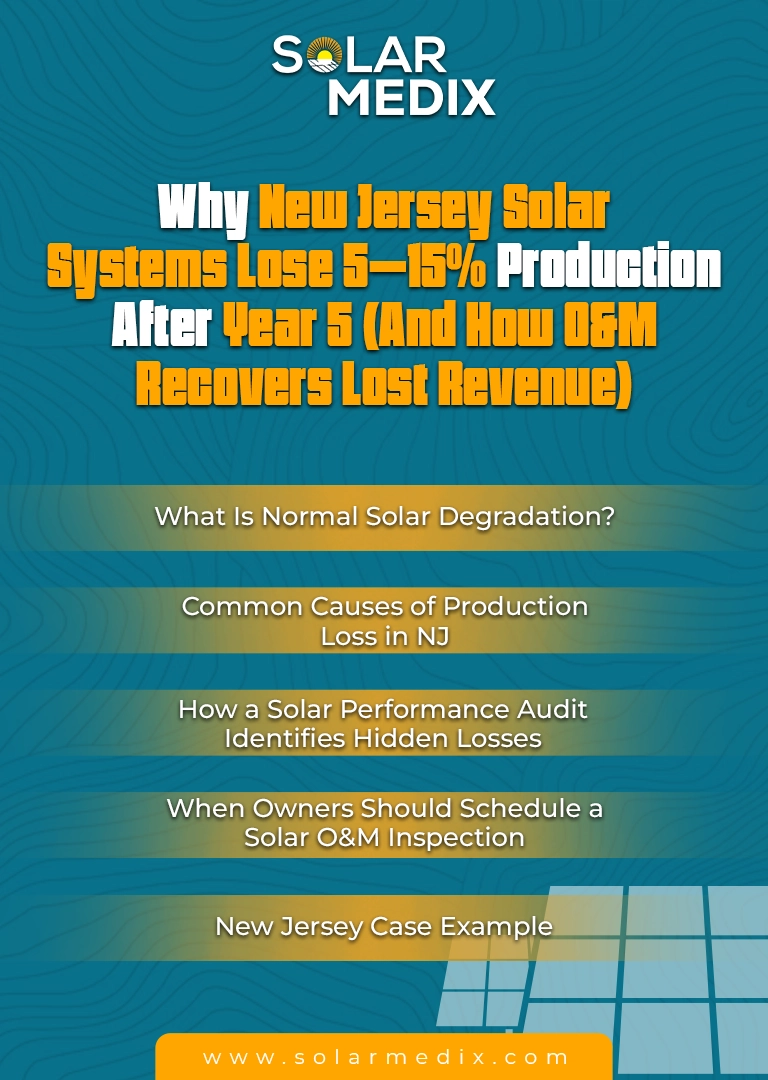
Many New Jersey commercial solar production loss more power than normal after year five because dirt, pollen, inverter wear, connector faults and hidden electrical issues build up over time. A common benchmark puts normal panel degradation near 0.5% per year, so anything far beyond that usually points to avoidable solar underperformance rather than simple aging.
Solar is often treated like a rooftop savings machine you can ignore once it goes live. That idea sounds great in a sales meeting but it falls apart in the field. By year five, even a strong system can start slipping if nobody is tracking the details.
And that is the real problem. A 5% to 15% drop does not always look dramatic on day one. It shows up quietly in lower yield, weaker cash flow, softer financial payback and missed revenue that should have stayed on the balance sheet. So, what is really causing that underperformance in Commercial Solar NJ systems after year five?
What Is Normal Solar Degradation?
Every solar module loses a little output over time. That part is normal. A widely cited rule of thumb puts average panel degradation around 0.5% per year, which means a well-performing system should still stay fairly close to its original capacity by year five.
That is why owners need to separate natural aging from avoidable asset underperformance. If a site is down 10% or more by year five, the issue usually is not simple panel age. Something else is dragging the plant down.
Expected Year-5 Output ≈ Original Output×(1−0.005)
5 Expected Year-5 Output ≈ Original Output×(1−0.005)5
That formula gives you the baseline. Anything well below it deserves a closer look.
Common Causes of Production Loss in NJ
New Jersey solar systems face pollen, moisture, cold winters, summer heat and long-term equipment wear. In this section, you will see the main reasons output drops and how those issues start inside a working system.
Inverter Degradation
The inverter adjusts the flow of solar energy, so it is usually where power output begins to diminish first.
- Thermal Stress: Hours of heating can cause the inverter to work below its standard operating value.
- Aging components: Internal parts get older with time and can cause random power outage issues.
- Insufficient Cooling: Inadequate fans or airflow can diminish output during projected time in direct sunlight.
- Warning signs: Inverter problems are often indicated by continual fault codes or midday production fewer than 300w.
Soiling and Pollen
Dirt on panel glass blocks sunlight and lowers how much energy the system can make.
- Pollen buildup: A yellow film across the array left by spring pollen.
- Dust deposits: Road dust or dry wind may settle on panel which can lead to limited light absorption.
- Bird droppings: Dirty stains can lead to uneven performance over modules.
- Stuck residue: Light rain may not remove grime once it dries onto the surface.
Bird Nesting Damage
Birds and small animals often use the space under solar panels as cover and that can lead to damage.
- Trapped heat: Nests block airflow and raise panel temperature.
- Wire damage: Rodents may chew insulation and expose wiring.
- Debris spread: Twigs, feathers and waste can collect under the system.
- Fire risk: Damaged wires and heat buildup can create a serious safety issue.
Read our latest blog, “Signs Animals Are Nesting in Your Solar System & You Need Critter Guard Solutions”
Connector Failures
Small connector faults can interrupt power flow and create hidden electrical problems.
- Freeze-thaw stress: Weather changes make connectors expand and tighten again and again.
- Loose contact: Weak connections can reduce string performance.
- Heat buildup: Extra resistance can create hot points inside the system.
- Hidden solar production loss: A connector issue may lower output without a clear visual sign.
PID and Hotspot Issues
Some faults happen inside the system and stay hidden until production falls too far.
- PID leakage: Voltage loss to the frame can reduce panel efficiency over time.
- Hotspots: Damaged cells can overheat and weaken the module.
- Cell mismatch: One weak area can affect nearby cells and reduce output.
- Silent damage: These problems often need thermal or electrical testing to confirm them.
How Much Revenue Is Lost?
| System Size (NJ Commercial) | Year 5 Baseline Yield | 15% Solar Underperformance Drop | Annual Revenue Lost (Est. @ $0.15/kWh) |
| 500 kW Array | 650,000 kWh | 97,500 kWh | $14,625 |
| 1 MW Array | 1,300,000 kWh | 195,000 kWh | $29,250 |
| 5 MW System | 6,500,000 kWh | 975,000 kWh | $146,250 |
How a Solar Performance Audit Identifies Hidden Losses
A real Solar O&M audit does not rely on guesswork. It follows a clear process that ties field findings back to production loss and revenue impact.
That is what makes the difference between “something feels off” and “here is the exact reason your site is losing money.”
- Analyze historical SCADA or monitoring data to compare actual yield against past baselines and expected irradiance.
- Review inverter logs for recurring faults, clipping behavior, shutdown patterns and weak string performance.
- Deploy aerial thermography or infrared inspection to spot hot cells, bypass diode failures and hidden module stress.
- Perform IV curve testing on suspect strings to compare real electrical behavior against nameplate expectations.
- Inspect connectors, combiner boxes and terminations for heat damage, corrosion or loose contact points.
- Measure insulation resistance to catch cable degradation and leakage before it becomes a major fault.
- Document all findings by asset location so repair work can be prioritized by financial impact, not by guesswork.
When Owners Should Schedule a Solar O&M Inspection
Waiting for a total failure is expensive. Most underperformance starts with smaller warning signs that show up earlier.
Owners and facility teams should book an solar O&M New Jersey when any of these triggers appear:
- SREC Volume Drop: Monthly SREC or SREC-II generation slips without a matching weather explanation.
- Inverter Error Codes: Ground fault, arc fault or grid mismatch alerts keep returning.
- Five-Year Milestone: The system reaches year five without a full engineering health review.
- Post-Storm Review: High wind, hail or roof work may have stressed modules or hardware.
- Flatlined String Data: Monitoring shows one inverter or one section lagging behind the rest.
- Unexpected Utility Spend: Grid purchases rise even though site operations have not changed much.
- Visible Pest Activity: Nesting, droppings or rodent damage appears around the array.
Read our latest blog, “Why Professional Inverter Repair Prevents System Damage”
New Jersey Case Example
According to the official industrial benchmark data published in the kWh Analytics Solar Risk Assessment, widespread equipment-driven underperformance causes significant revenue leakage across aging commercial fleets.
Statistical field analysis confirms that balance of system (BOS) anomalies—specifically localized string faults, failing inverter cooling components and thermal module degradation—increase sharply after year five.
For a standard 1.2 MW regional commercial installation, a typical 11.4% operational deficit from unmitigated environmental soiling and hardware clipping erases roughly 171,000 kWh of annual energy. Deploying a targeted performance audit and replacing faulty components immediately restores this output, protecting over $25,650 in yearly SREC and grid revenue.
Stop Bleeding Commercial Solar Revenue
A 10% production loss on a commercial site is not a rounding error. It is real money leaving the project every year. By year five, passive ownership stops being safe and starts becoming costly.
With over 17 years of hands-on field experience, our team specializes in diagnosing and fixing deep-system faults that standard monitoring software misses. If your array is underperforming, now is the time to move from assumptions to actual numbers.
Book A Commercial Solar O&M NJ Today!
Hidden faults do not fix themselves. Every season you delay is another quarter of leaked SREC revenue and dropped utility credits.
Contact the engineering team at Solar Medix today to schedule your comprehensive commercial solar assessment and recover your lost output.
FAQs
Why Is My New Jersey Solar System Producing Less Electricity?
Commercial solar systems are not producing enough power over time because of avoidable issues like inverter wear, pollen buildup, connector heating, pest damage and hidden hot spots. Natural panel aging is usually modest by comparison often near 0.5% per year rather than a sharp 5% to 15% drop.
How Much Solar Degradation Rate Is Normal?
A common benchmark puts normal photovoltaic degradation around 0.5% per year, which means year-five losses should be relatively modest on a healthy system. If output drops far beyond that, the cause is often operational trouble rather than ordinary module aging.
When Should Commercial Solar Panels Be Inspected?
Commercial arrays should get routine solar inspection services at least once or twice each year, then a deeper engineering-grade review by year five or sooner if output drops, error codes repeat or monitoring data starts showing unusual losses.
Can Proactive Solar Maintenance Increase Production Revenue?
Yes. Proactive commercial solar maintenance can recover lost production by finding issues like dirt buildup, connector faults, inverter inefficiency and thermal hotspots before they keep draining output. On commercial sites, even a small gain can mean meaningful revenue recovery.


")